Classically, a static PDF CV is created. Since July 2015, Microsoft Power BI is officially available (more information) and offers the possibility to link and visualise data sources.
The idea comes from one of many LinkedIn posts on the subject: LinkedIn Post – CV Dashboard
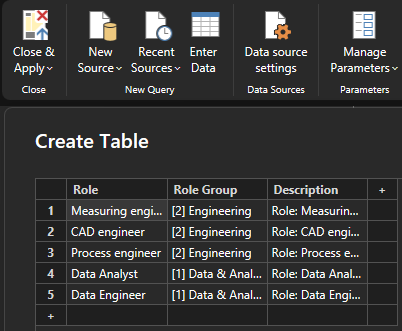
The data source for the Power BI CV could be an Excel file, which you have to fill in individually. Due to the small amount of data, the data can also be saved directly within PowerBI, which makes an additional external data source, Excel, unnecessary. Use the “Enter Data” button and create any source table:

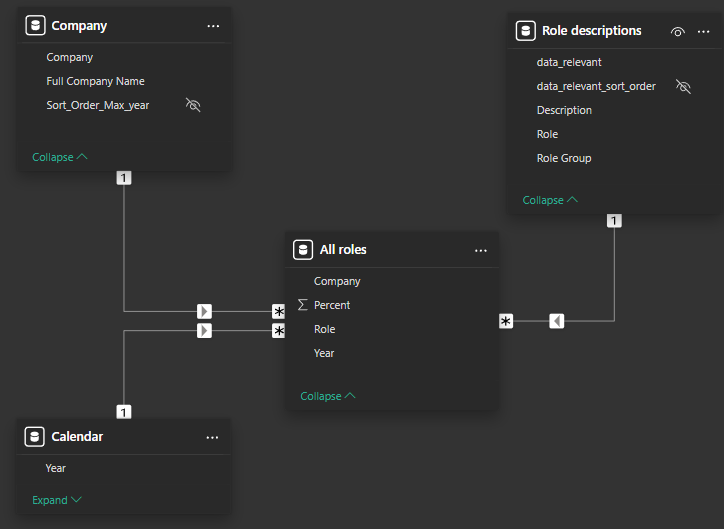
The data model could look like this: A fact table in which the information is stored in which company, when and to what extent in which role was worked. It should be possible to aggregate this percentage per year. Create descriptive dimensions around the fact: Calendar, Role Description and Company.

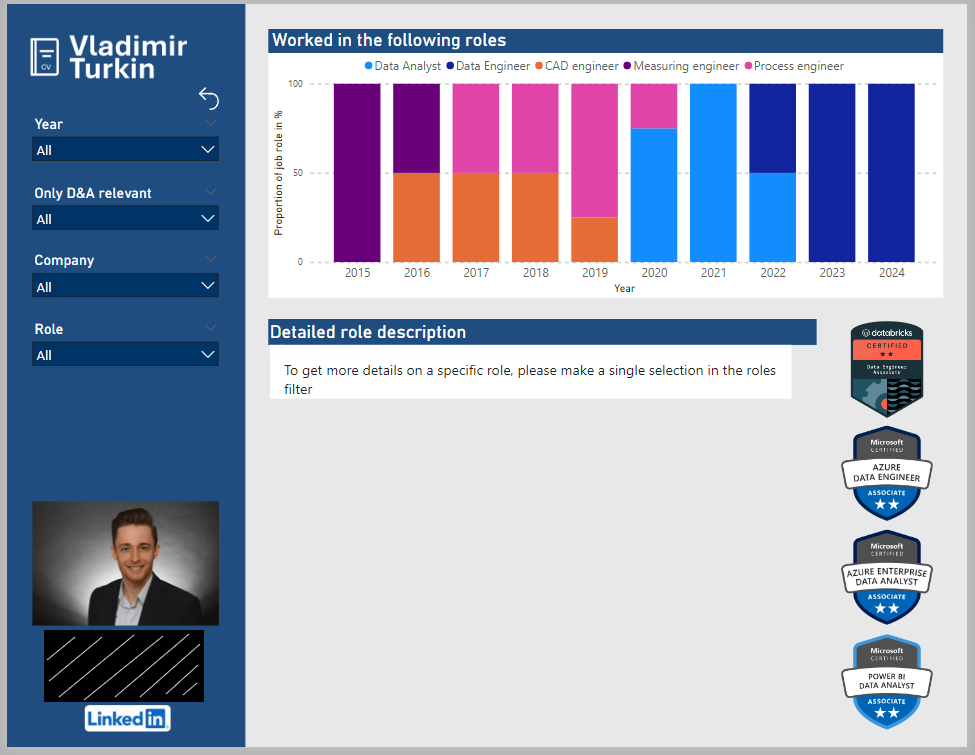
This setup allows you to create a dashboard – Try to get some value out of using PBI, do not copy a PDF report layout, use the functionality of an interactive dashboard. Show the evolution of roles or skills over time, create the possibility to read more in detail about a role without showing all the information at all times. Create filters to reduce the view to a relevant time period.

Some more feature ideas:
